
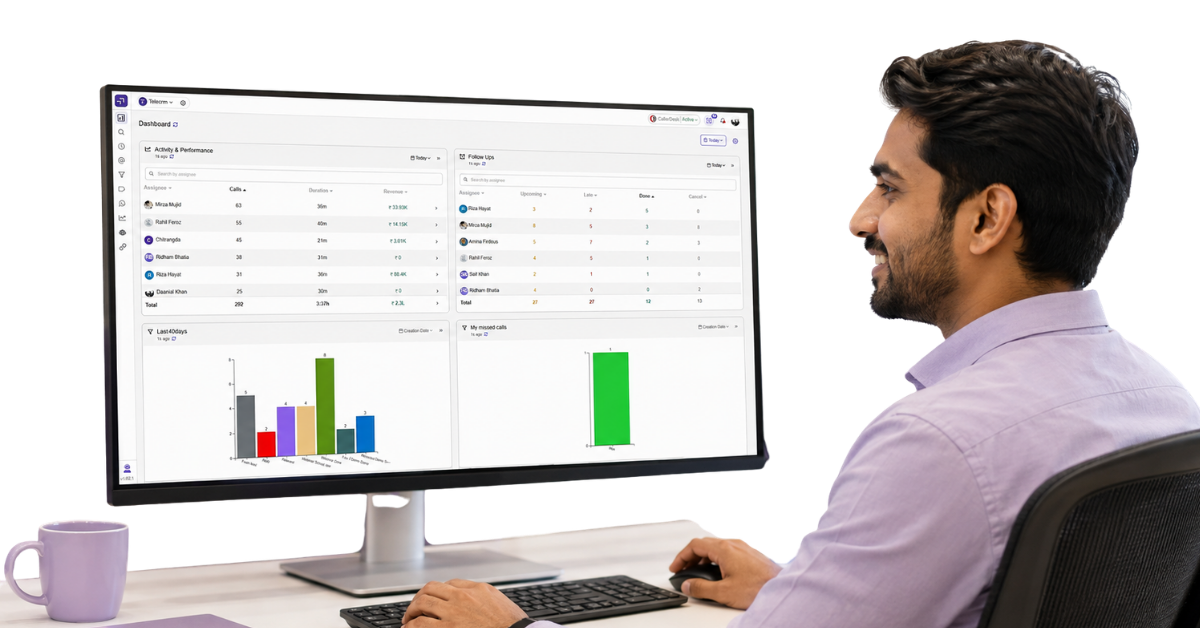
Your CRM may contain thousands of leads, calls, messages, follow-ups and sales activities. But having all that data does not automatically tell you what is happening in your business.
Are new leads being contacted on time? Which deals have stopped moving? Why is one sales representative converting more leads than another? Which campaigns are bringing qualified opportunities rather than just increasing lead volume?
A CRM dashboard brings these answers together in one clear view. It converts your customer and sales data into charts, numbers and visual reports that help sales, marketing and customer service teams understand performance without going through individual lead records or waiting for manual updates.
More importantly, a useful dashboard does not simply show what has already happened. It highlights where attention is needed now, whether that means contacting untouched leads, completing overdue follow-ups, coaching a struggling representative or fixing a stage where deals repeatedly get stuck.
A CRM dashboard is a visual summary of the most important data stored in your customer relationship management system. It brings information about leads, deals, sales activities, marketing campaigns and customer interactions into one place, helping your entire team understand what is happening without checking individual records.
Instead of presenting rows of raw customer data, a dashboard uses data visualisation elements such as charts, scorecards, tables, funnels and progress bars. These help users track progress against sales goals, compare conversion rates, monitor pipeline stages and identify trends across a selected time period.
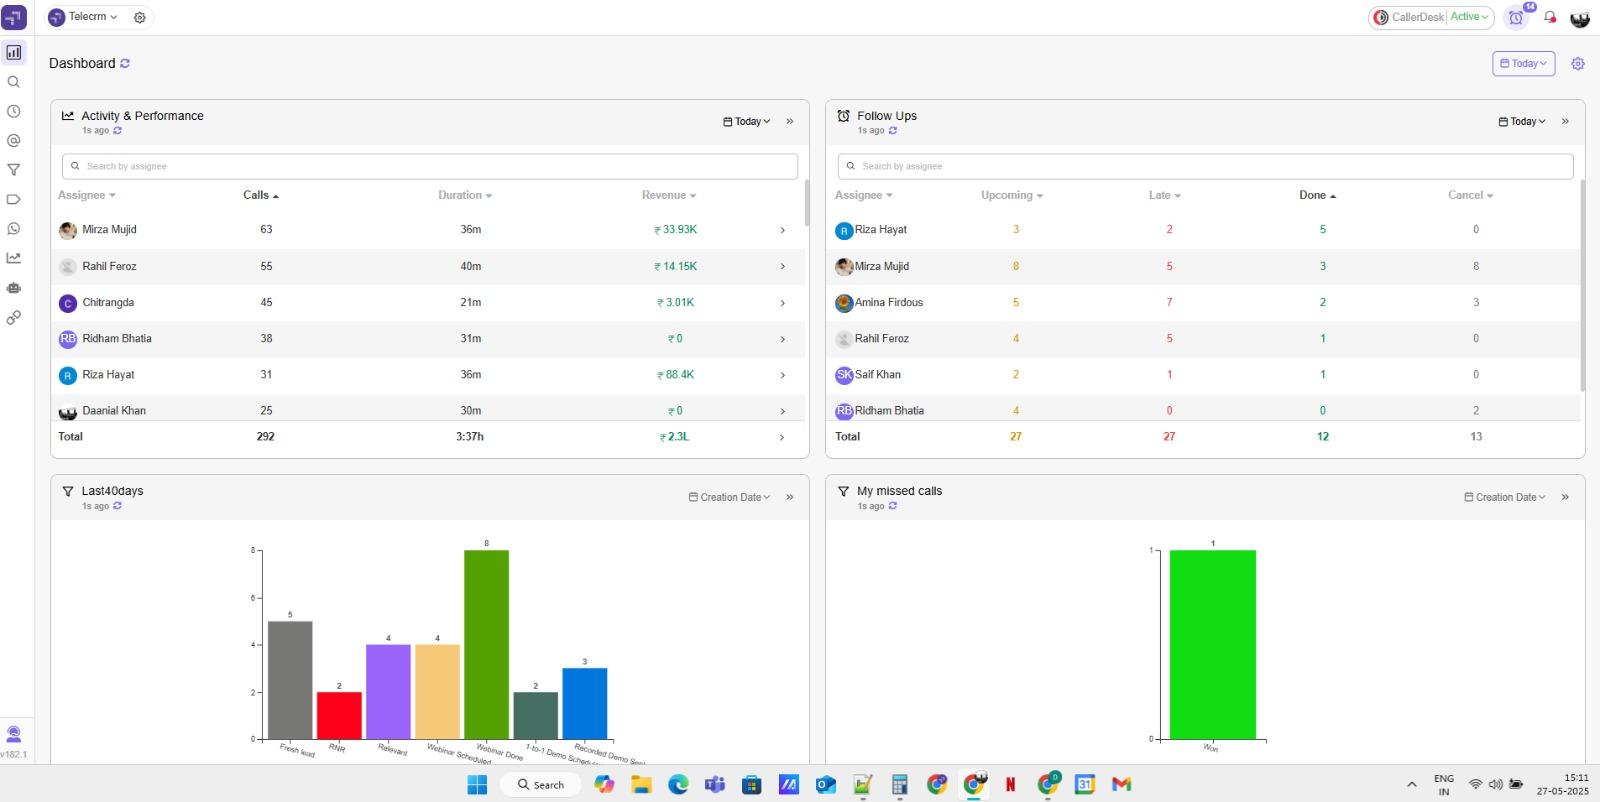
For example, a sales manager can use the dashboard to check how many qualified leads entered the sales pipeline, how many became qualified opportunities and how many turned into closed deals. They can also monitor deal counts, win rate, potential revenue, sales cycle length and deal velocity to understand whether the sales process is moving efficiently.
A CRM dashboard is useful for anyone who needs to make decisions using customer data. However, sales, customer service and marketing teams should not work from the exact same dashboard because each team has different goals, responsibilities and key crm metrics.
Sales teams need a CRM dashboard to understand what is happening across the sales process and where they should focus next. Sales representatives can track their assigned leads, upcoming follow-ups, pending tasks and closed deals, while sales managers get a wider view of the entire team.
A sales dashboard can show:
For example, high activity with low conversion rates may mean a sales rep needs help with qualification or pitching. Strong conversion with low activity may indicate that a top performer needs more leads. This makes the CRM dashboard useful for coaching and planning, not merely activity tracking.
Sales leaders can also compare pipeline stages, deal counts and sales cycle length over a selected time period. This helps them identify stuck deals, understand why opportunities are being lost and adjust their sales strategies before the month ends.
Customer service teams need a CRM dashboard to monitor customer inquiries, response times, unresolved concerns and overall customer satisfaction. It gives the team a shared view of every customer interaction, from the initial contact to ongoing support and retention.
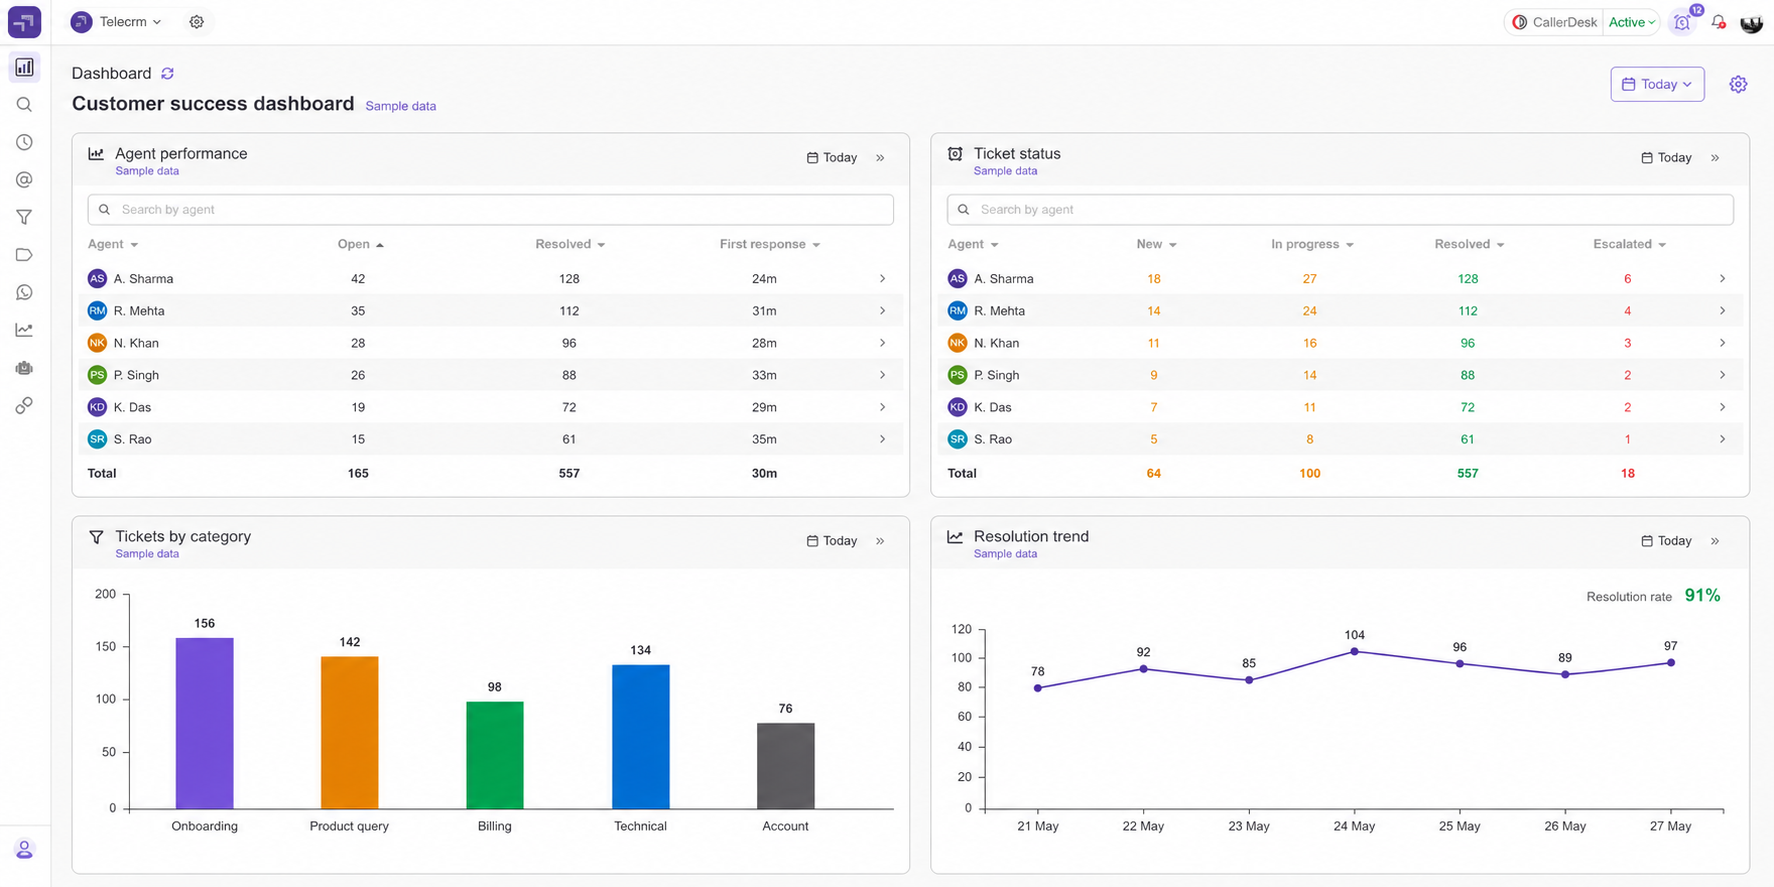
A customer service dashboard may include:
When customer service data is stored in the same CRM, support representatives do not have to ask customers to repeat information already shared with sales or marketing. They can check the complete customer history, understand the context and respond more effectively.
Over time, the dashboard also helps businesses identify trends in complaints and customer behaviour. If several customers raise the same issue, the business can fix the underlying problem rather than resolving each inquiry separately.
Marketing teams need a CRM dashboard to understand what happens after a lead enters the CRM. Campaign clicks and form submissions show initial interest, but they do not reveal whether those leads become qualified opportunities, customers or potential revenue.
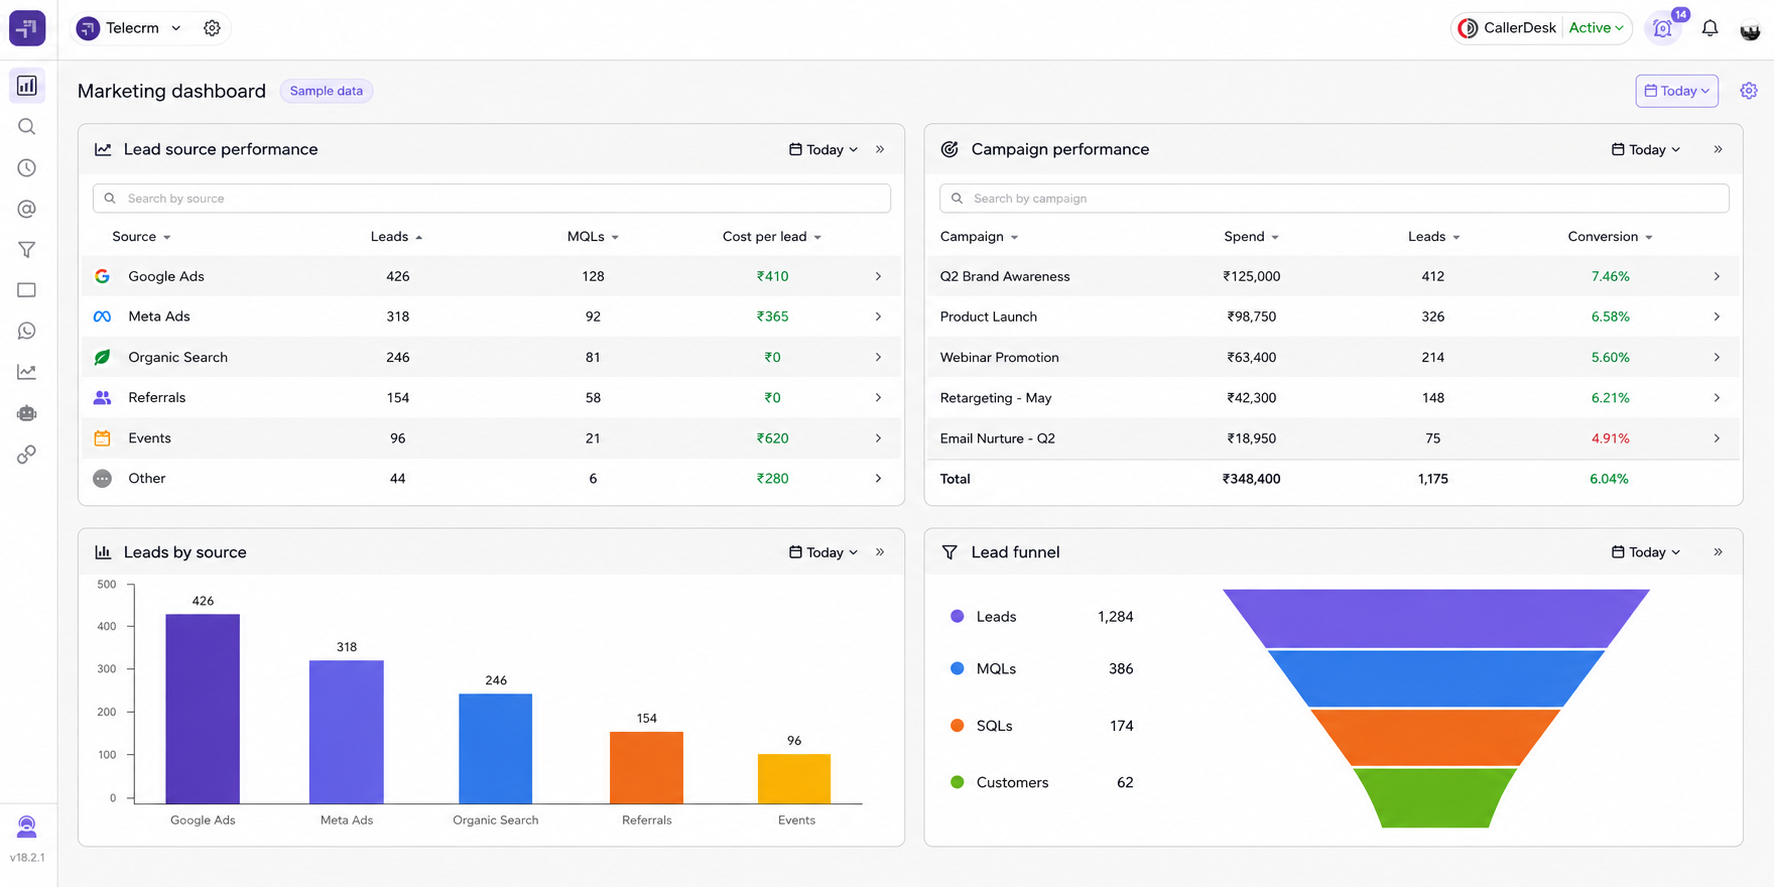
A marketing dashboard can track:
These metrics connect marketing efforts with sales results. For example, one campaign may generate a high number of leads but very few closed deals, while another may generate fewer leads with a much stronger win rate. Without CRM data, the first campaign may incorrectly appear more successful.
A shared CRM dashboard also keeps marketing and sales aligned. Marketing teams can learn which channels bring the right customers, while sales teams can provide feedback on lead quality. This helps both teams invest their time and budget in campaigns that contribute to business growth.
The right CRM dashboard metrics show whether your team is taking the right actions and whether those actions are producing results. A useful dashboard should connect lead generation, sales activity, pipeline movement and revenue instead of displaying isolated numbers.
New leads show how many prospects entered your CRM during a specific time period. You can filter this metric by day, week, month, product, location, campaign or sales representative.
Tracking new leads helps sales managers understand the workload entering the system. However, lead volume alone does not indicate quality. It should always be compared with qualified leads, conversion rates and closed deals.
Lead response time measures how long it takes a sales representative to make the initial contact after receiving a new lead. It helps managers identify whether leads are being contacted while their interest is still active.
The dashboard can compare response times across representatives, teams and data sources. If one campaign generates valuable leads but contact is consistently delayed, the problem may lie in lead assignment or sales capacity rather than marketing.
Untouched leads are leads that have entered the CRM but have not received a call, message, email or follow-up. This is one of the most important metrics for businesses that receive leads from several marketing campaigns.
A rising untouched-lead count may indicate slow lead distribution, poor activity tracking or an uneven workload. Sales managers can use this insight to redistribute leads or remind sales representatives before opportunities are lost.
This metric shows where your leads come from, such as Google Ads, Meta Ads, website forms, referrals, marketplaces or offline campaigns. It gives marketing and sales teams a shared view of lead generation.
The real value comes from comparing lead sources with qualified opportunities, closed deals and potential revenue. A source producing fewer leads may still be more valuable if those leads have stronger conversion rates and a higher customer lifetime value.
Sales activity metrics track calls, connected conversations, WhatsApp messages, meetings and completed follow-ups. They help sales leaders understand how consistently their teams are working on assigned opportunities.
Activity should never be judged alone. A high call count with poor conversions may indicate weak targeting or ineffective conversations. Lower activity with strong results may indicate that a top performer can handle more opportunities.
The follow-up completion rate measures how many scheduled follow-ups were completed within the selected time period. The dashboard should separate completed, upcoming, missed and overdue follow-ups.
This metric is particularly important when the sales process requires several customer interactions. If qualified leads are not converting, missed follow-ups may be the real issue rather than poor lead quality.
This metric shows how leads are distributed across different pipeline stages, such as fresh, contacted, interested, qualified, proposal shared, won or lost. It gives sales managers a clear picture of pipeline health.
If too many leads remain in one stage for a long time, that stage may contain a bottleneck. Managers can then check individual deals, review customer conversations and determine what is preventing further movement.
The stage conversion rate measures the percentage of leads that move from one pipeline stage to the next. It helps businesses understand where potential customers progress and where they drop out.
For example, a business may generate many qualified leads but convert very few into meetings. This suggests that the team should review its pitch, availability or follow-up process at that specific stage instead of changing the entire sales strategy.
Win rate is the percentage of qualified opportunities that become closed deals. It is one of the most direct measures of sales performance, but it should be analysed alongside lead quality, deal value and sales cycle length.
Sales managers can compare win rate by representative, source, product or time period. This reveals which sales strategies work, which campaigns attract the right customers and which representatives may need coaching.
Deal velocity measures how quickly opportunities move through the sales pipeline. It helps sales leaders identify deals that are moving normally and those that have remained inactive for too long.
A slow deal velocity may point to delayed follow-ups, unclear next steps, repeated objections or decision-making delays. Tracking this metric helps the team intervene while the opportunity is still active.
Sales cycle length measures the average time between the initial contact and a closed deal. It helps businesses understand how long a typical conversion takes and plan revenue more realistically.
This metric can also reveal differences across products, lead sources and sales representatives. If one representative closes similar deals faster without reducing the win rate, sales managers can study their process and use it to coach the entire team.
Use CRM sales forecasting to combine this timing information with deal values and realistic close probabilities.
Revenue and target achievement compare actual results with individual, team or business sales goals. A CRM dashboard may show revenue generated, total pipeline value, potential revenue and the percentage of the target completed.
This final metric should be read alongside the earlier activity and pipeline metrics. Revenue explains the outcome, while calls, follow-ups, conversion rates and deal velocity explain what produced it. Together, these metrics give managers the context required to recognise top performers, find performance gaps and take action.
A CRM dashboard gives you a live, visual view of the key metrics that need regular attention. A CRM report provides a more detailed analysis of customer data, sales activities and performance over a selected time period.
The dashboard helps you spot a problem quickly. The report helps you investigate the problem more deeply.
Area | CRM dashboard | CRM report |
Purpose | Monitor current performance | Analyse performance in detail |
Data view | Visual and summarised | Detailed and structured |
Updates | Often uses real-time data | Generated for a chosen period |
Information | Selected key metrics | Wider set of data |
Format | Charts, funnels and scorecards | Tables, summaries and detailed charts |
Usage | Checked daily or frequently | Reviewed weekly, monthly or quarterly |
Best for | Finding areas that need attention | Understanding causes and patterns |
Customisation | Changes by role or goal | Changes by question or analysis |
Example | Leads stuck in a pipeline stage | Reasons leads are stuck in that stage |
Action | Shows where to act | Helps decide how to act |
For example, a sales manager may notice on the CRM dashboard that the win rate has fallen this month. They can then open a CRM report to compare sales representatives, lead sources, products, lost reasons and customer interactions to understand what caused the decline.
Similarly, the dashboard may show that one marketing campaign generated many qualified leads but very few closed deals. A detailed report can reveal whether those leads received a delayed initial contact, stopped at a specific pipeline stage or required more follow-ups.
Both tools are therefore necessary. A dashboard supports fast monitoring, while a report supports deeper analysis. Modern analytics tools and CRM systems often connect the two, allowing users to click a dashboard metric and access the records behind it. This makes it easier to move from a warning sign to a clear explanation.
A CRM dashboard creates value only when the information changes what your team does next. Every important metric should point to a problem, an owner and a specific action.
Sales managers do not need to study every number every day. They should begin with metrics that have moved away from the expected range, such as a sudden rise in untouched leads, overdue follow-ups or lost deals.
This keeps daily reviews focused. Instead of asking the entire team for updates, the manager can go directly to the representatives, pipeline stages or campaigns where the problem appears.
A dashboard shows the signal, but managers should check the underlying CRM data before deciding what caused it. For example, a low conversion rate could result from poor lead quality, delayed initial contact, weak qualification or ineffective follow-ups.
Filters help narrow the issue by sales representative, lead source, product, location or time period. A detailed CRM report can then provide the customer interactions and records required to confirm the cause.
Every action should have one owner. If untouched leads are rising, someone must review lead distribution. If one pipeline stage is slowing down, a sales manager should examine the affected opportunities. If customer inquiries are increasing, the customer service team should collect feedback and identify the pattern.
Without clear ownership, actionable insights become observations that everyone notices but nobody addresses.
Not every metric requires the same review schedule. Operational metrics such as new leads, first-response time and overdue follow-ups may need daily attention. Pipeline movement and sales rep performance can be reviewed weekly, while customer lifetime value and retention are better assessed over longer periods.
The review frequency should match how quickly the business can act on the data. Checking a metric every day is pointless if meaningful change can only be assessed monthly.
Activity tracking explains what the team did, while outcome metrics explain what those actions achieved. Both views are necessary.
Calls should be compared with connected conversations and qualified opportunities. Meetings should be compared with proposals and closed deals. Marketing campaigns should be compared with revenue and customer lifetime value, not merely lead volume.
This prevents managers from rewarding busy work that does not improve sales performance.
Once a change has been made, continue tracking the same metrics. If leads were redistributed to reduce response time, check whether initial contact became faster and conversion rates improved. If representatives received coaching, compare their activity and win rate before and after the intervention.
This closes the loop between data, decisions and results. Over time, the CRM dashboard becomes more than a monitoring tool. It becomes a practical system for improving team performance and refining the sales process.
Also read: 7 Essential CRM Best Practices For Business Growth In 2026
A CRM dashboard should do more than make business data look organised. It should show what is working, where opportunities are being lost and what your team needs to do next.
The right dashboard connects lead sources, calls, WhatsApp conversations, follow-ups, pipeline stages, sales rep performance and closed deals. This gives sales managers a complete view of the sales process while helping representatives focus on the leads and activities that need immediate attention.
telecrm brings these customer interactions and sales activities into one system. Its customisable, role-based dashboards help businesses track leads, monitor team performance, identify missed follow-ups and understand how opportunities move through the pipeline. Instead of depending on scattered spreadsheets and manual updates, managers get the visibility required to act quickly.
If you want a CRM with dashboard built around how your sales team actually works, book a demo of telecrm.
A CRM dashboard is a visual screen that displays important customer, sales and team data in one place. It helps sales managers track pipeline stages, lead activities, conversion rates, follow-ups and sales performance without checking multiple reports or individual customer records.
A CRM dashboard should include metrics related to leads, deals, activities and revenue. Common metrics include new leads, qualified opportunities, pipeline value, conversion rate, win rate, sales cycle length, overdue follow-ups, lost deals and individual sales rep performance.
A CRM dashboard provides a quick visual summary of current sales performance using charts, numbers and progress indicators. A CRM report contains more detailed data for deeper analysis. Teams use dashboards for daily monitoring and reports to investigate trends, compare periods and understand performance issues.
A CRM dashboard helps sales managers identify pipeline gaps, missed follow-ups, inactive leads and differences in rep performance. It provides the information needed to prioritise deals, coach sales representatives, distribute leads and take corrective action before opportunities are lost.
Sales teams should track lead volume, qualified leads, pipeline value, conversion rate, win rate, sales cycle length, deal velocity, lost reasons, overdue follow-ups and rep activity. The right metrics depend on the company’s sales process, goals and customer journey.



© Copyright 2026 telecrm.in (Flamon Cloudtech Pvt Ltd) - All Rights Reserved • Privacy Policy • T&C



© Copyright 2026 telecrm.in - All Rights Reserved • Privacy Policy • T&C