
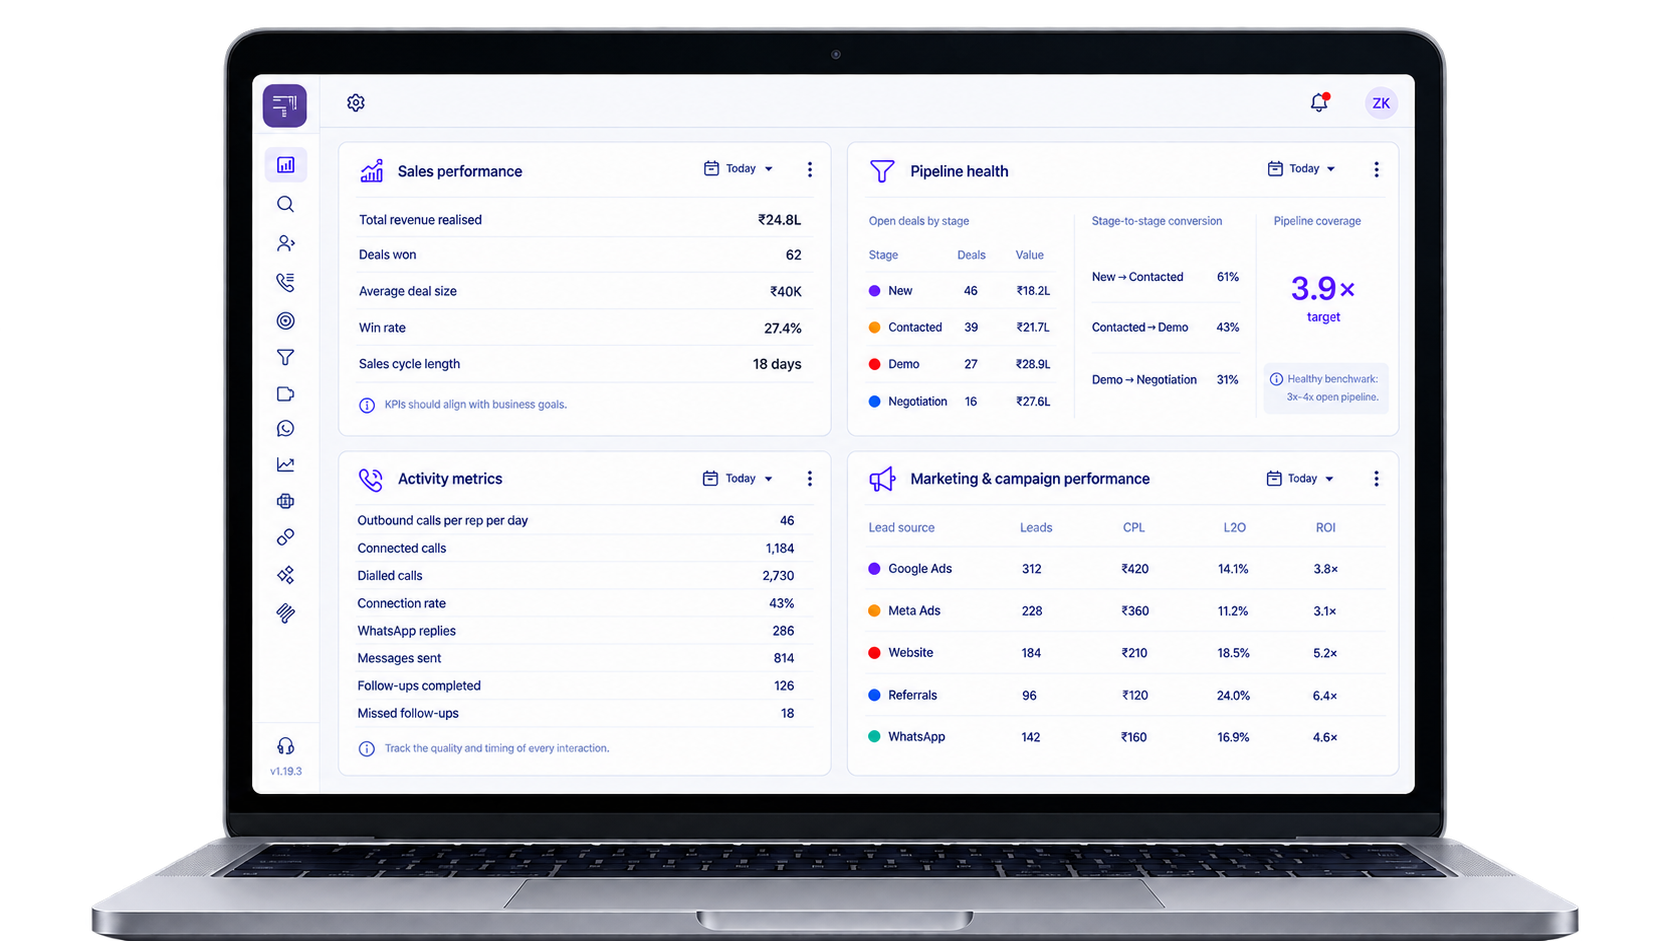
Every sales call your team makes, every WhatsApp message they send and every deal they move through the pipeline generates data. But data sitting untouched inside a CRM system is just noise. CRM reporting is how you turn that noise into decisions that actually grow revenue – and for Indian SMBs running telecalling and WhatsApp-first teams, getting this right can be the difference between scaling up and stalling out.
This guide breaks down everything you need to know about CRM reporting: the types of CRM reports that matter, the key metrics to track, how to set up your first reports and how tools like telecrm make all of this practical for small, fast-moving sales teams.
CRM reporting is the process of transforming raw data – calls made, WhatsApp chats logged, deals created, campaigns run – from your CRM software into structured reports that track key metrics like sales performance, pipeline health and campaign effectiveness. In essence, CRM reporting involves four steps: data collection, analysis, report generation and action.
Without CRM reporting, business strategies are driven by opinions and whichever team member speaks the loudest in the Monday meeting. There is no objective baseline. No way to separate a genuinely effective campaign from one that just feels busy.
CRM reporting matters because it connects actions – calls made, WhatsApp messages sent, marketing campaigns run – to outcomes like revenue, conversions and retention. This creates a data-driven culture where decisions replace guesswork. Data-driven decisions replace guesswork in business strategies and CRM reporting enhances decision-making with real-time data access.
Here is what that looks like in practice:
Real-time data updates ensure decisions are based on the latest information, not last month’s stale spreadsheet.
Think of CRM reports as “deep dives over a specific period” and CRM dashboards as “live, visual views updated in real time.” Both serve the same goal – making CRM data useful – but they work differently and are used at different moments.
telecrm example: A “Team Call Activity” dashboard shows real-time calls, talk time and connected percentage for each agent. At the end of the month, a separate CRM report is exported as a CSV for deeper analysis by campaign and lead source. CRM reports provide real-time visibility into sales performance at both levels.
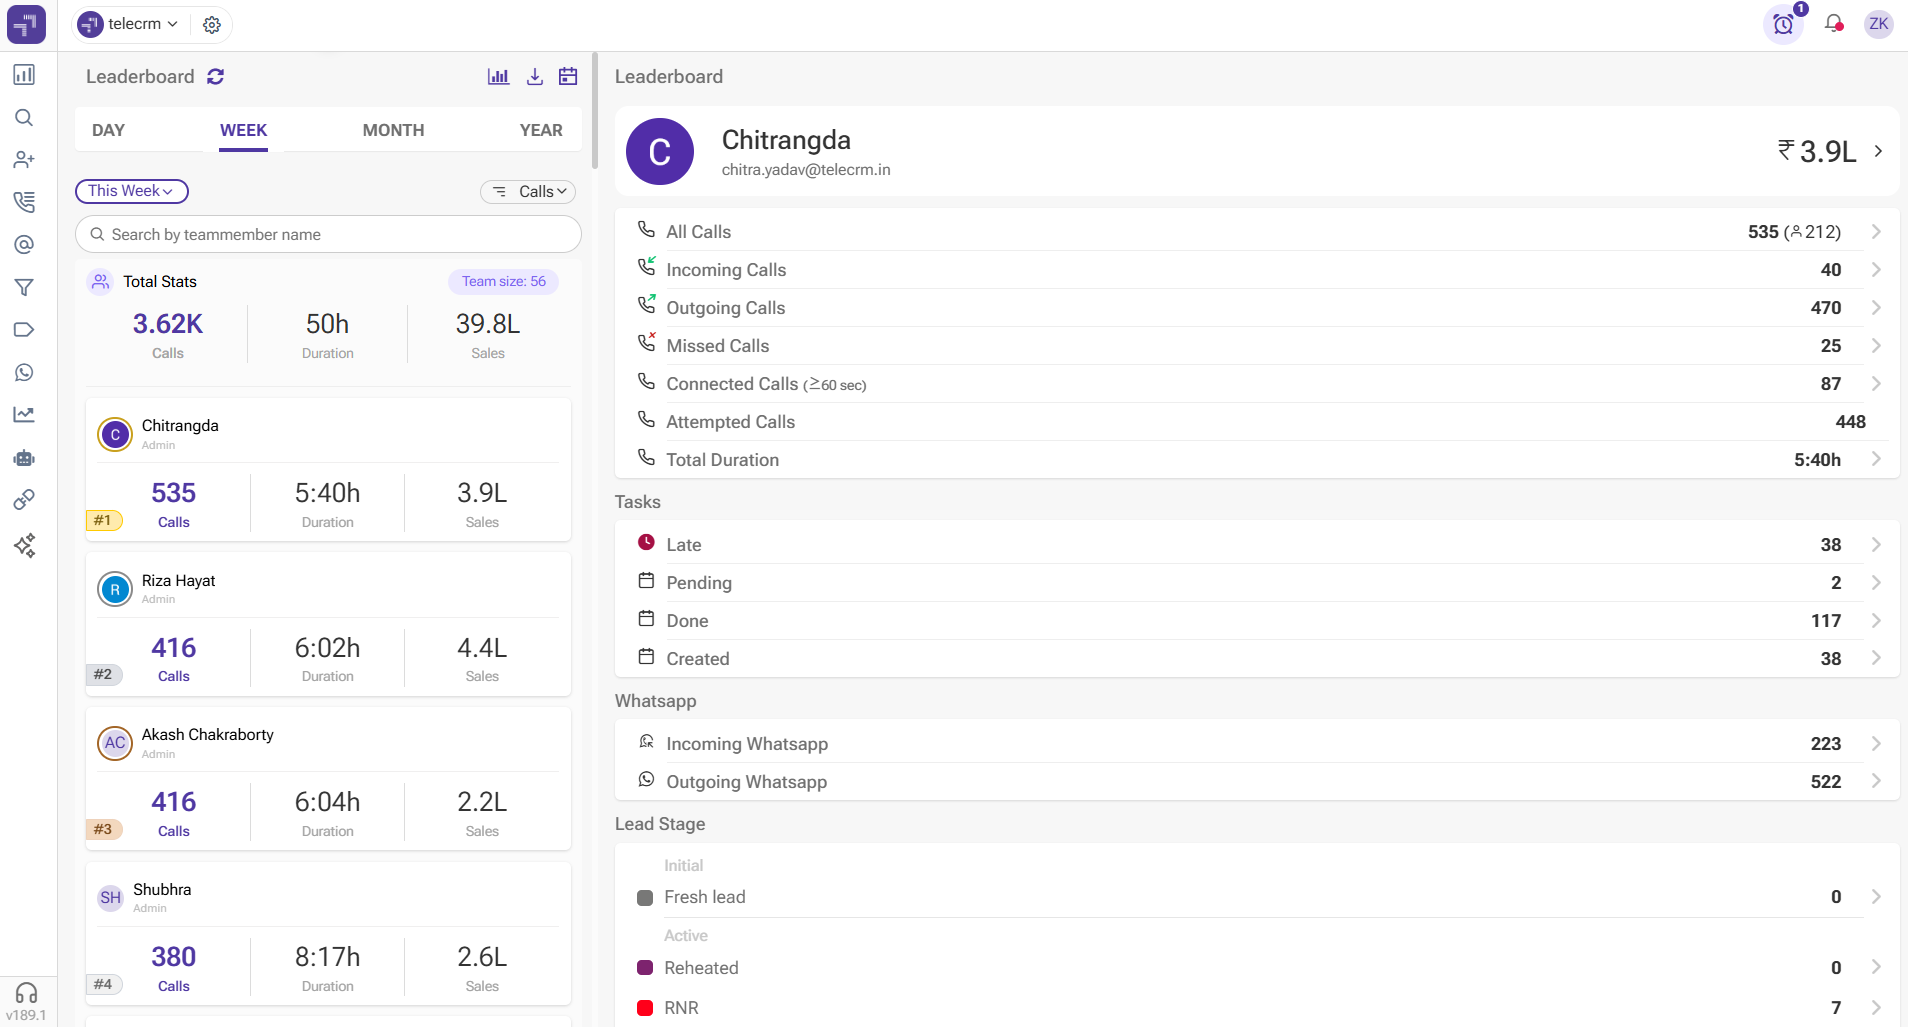
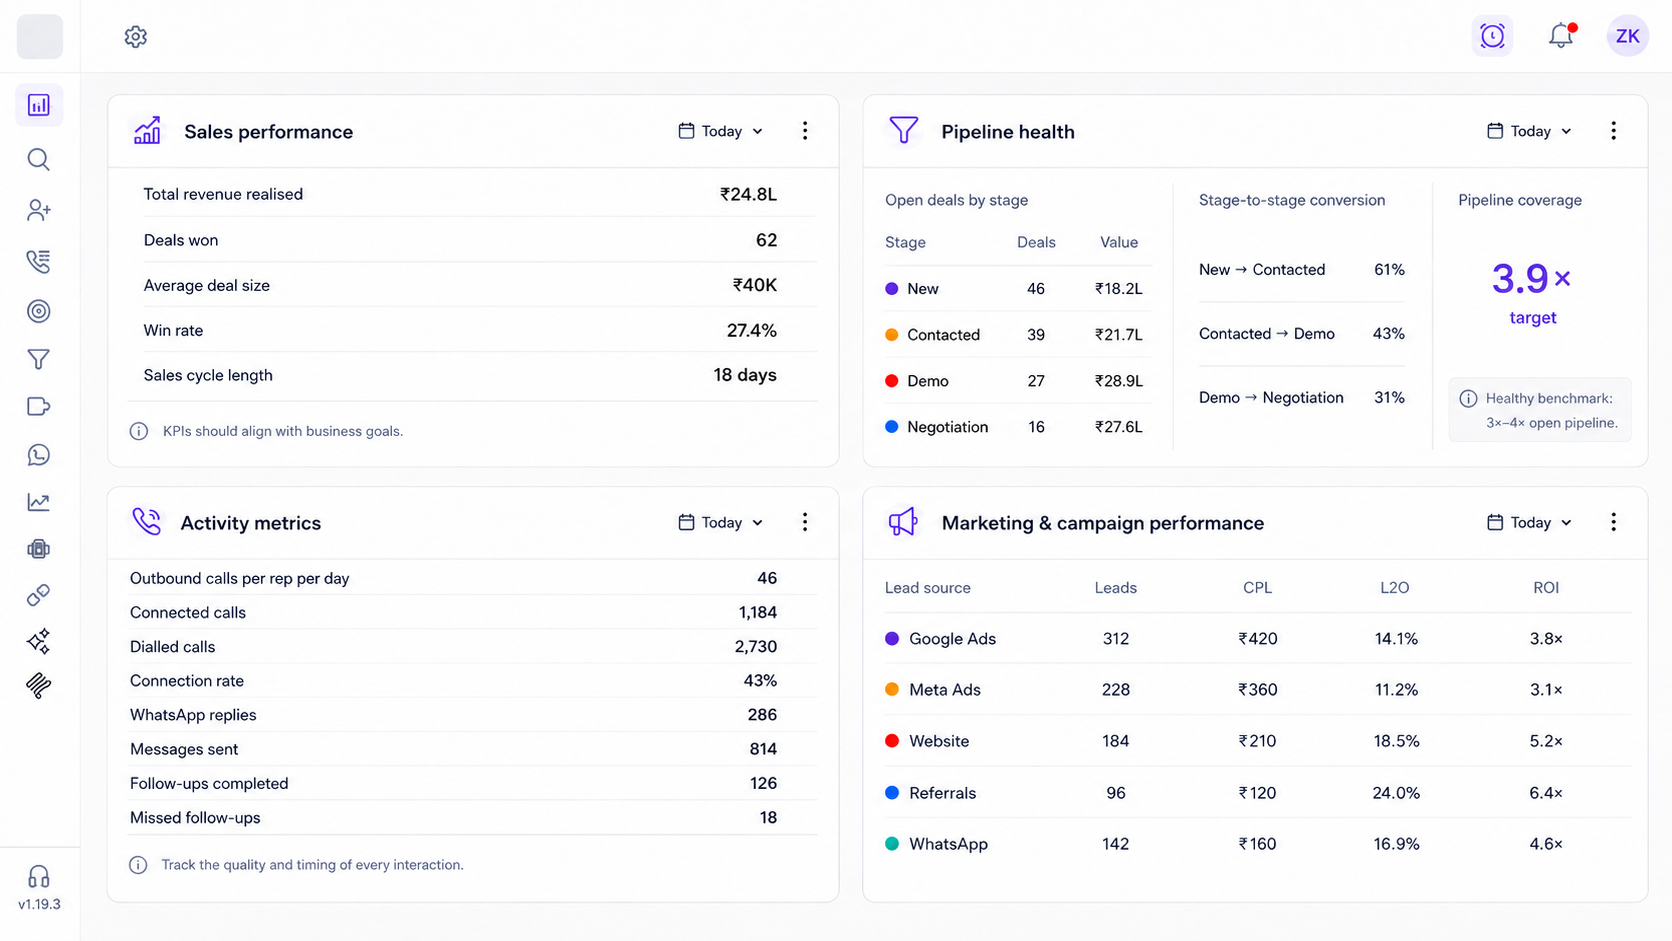
Effective CRM reporting starts by choosing the right key metrics rather than tracking everything. Tracking 40 metrics leads to noise. Tracking 8–10 leads to clarity.
Sales performance metrics:
Key performance indicators like these should align with business goals – not just look impressive on a slide.
Pipeline health metrics:
Sales pipeline metrics track deals through various stages to optimise conversion and accurate revenue forecasting relies on historical win rates and sales cycles.
Activity metrics (especially important for telecalling teams):
Customer activity tracking includes historical records of touchpoints, which means you can see not just volume but the quality and timing of every interaction.
Marketing and campaign performance metrics:
For more on which sales metrics to prioritise, start with the ones that directly map to revenue and work backwards.
CRM dashboards should surface only 8–10 of these key metrics, while detailed custom reports can go deeper for quarterly audits and strategic planning.
The flow is straightforward: data capture → data cleaning → analysis → visualisation → action.
Most CRMs can produce dozens of reports. Very few of them change what anyone does on Monday morning. These seven do, because each one answers a question a sales manager is already asking out loud.
What it answers: how much business is live right now, and where it is stuck.
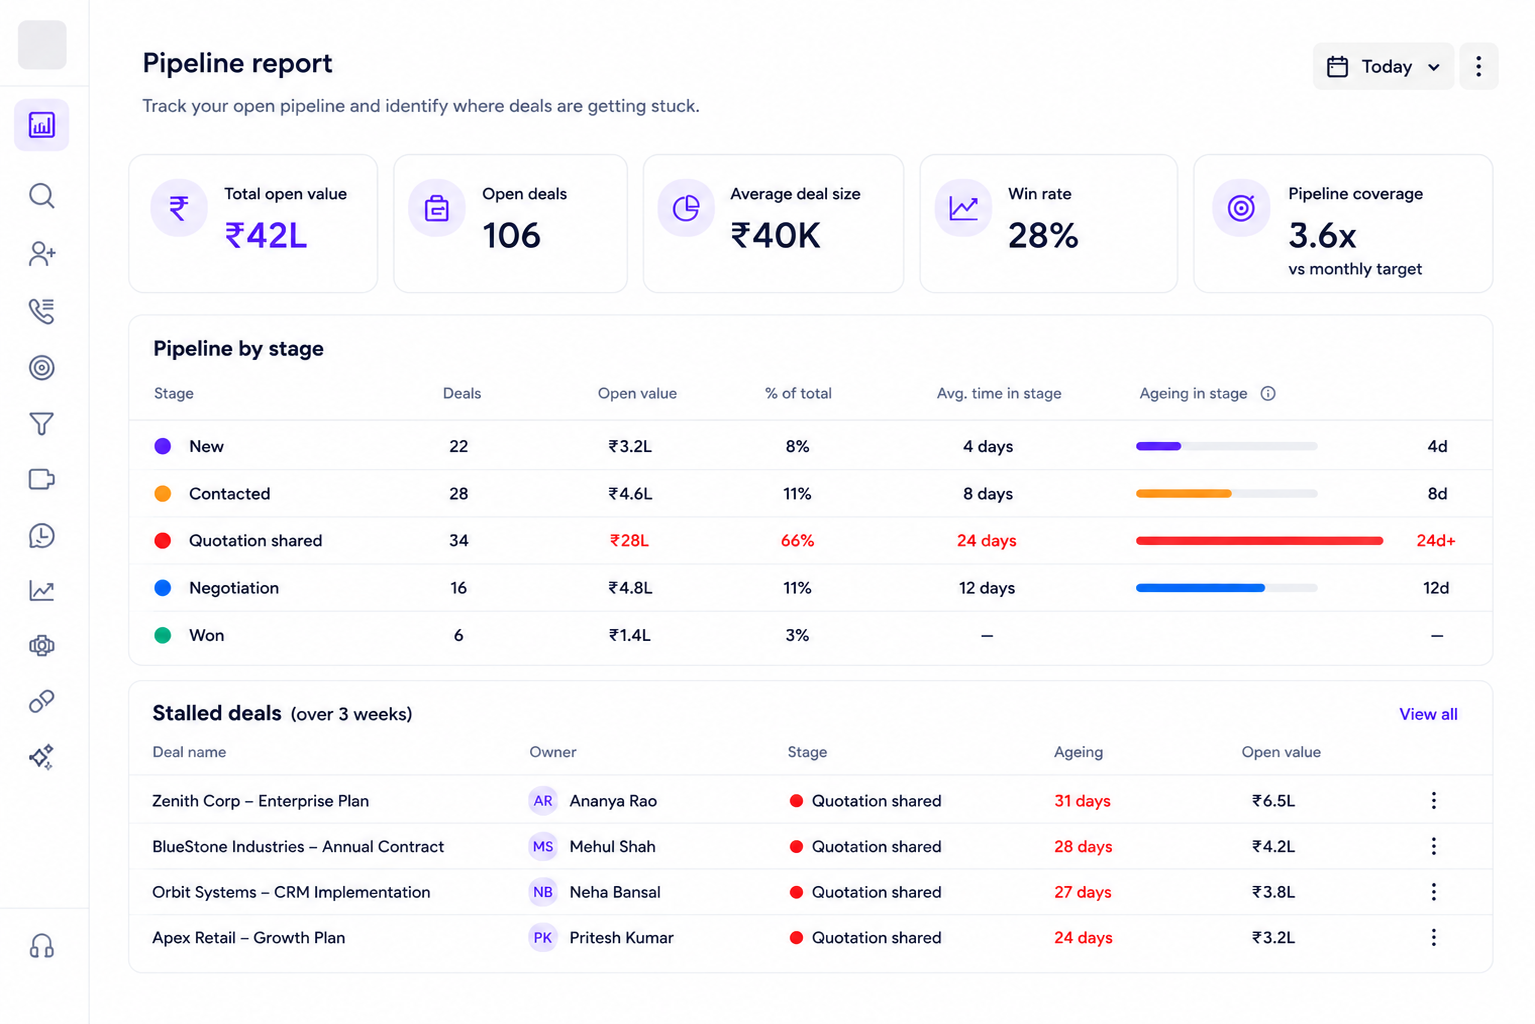
Look at the total open value first, then break it down by stage. The number that matters more than either is how long deals have been sitting in each stage. A pipeline worth ₹42 lakh looks healthy until you see that ₹28 lakh of it has been sitting at quotation shared for more than three weeks.
If most of your value is piled up in the first two stages, you have a qualification problem. Your team is adding leads faster than it is working them. If the value is stuck late in the pipeline, the problem is follow-up and the fix is a list of stalled deals with owner names against them, not a motivational meeting.
What it answers: how much work is actually happening on the floor.
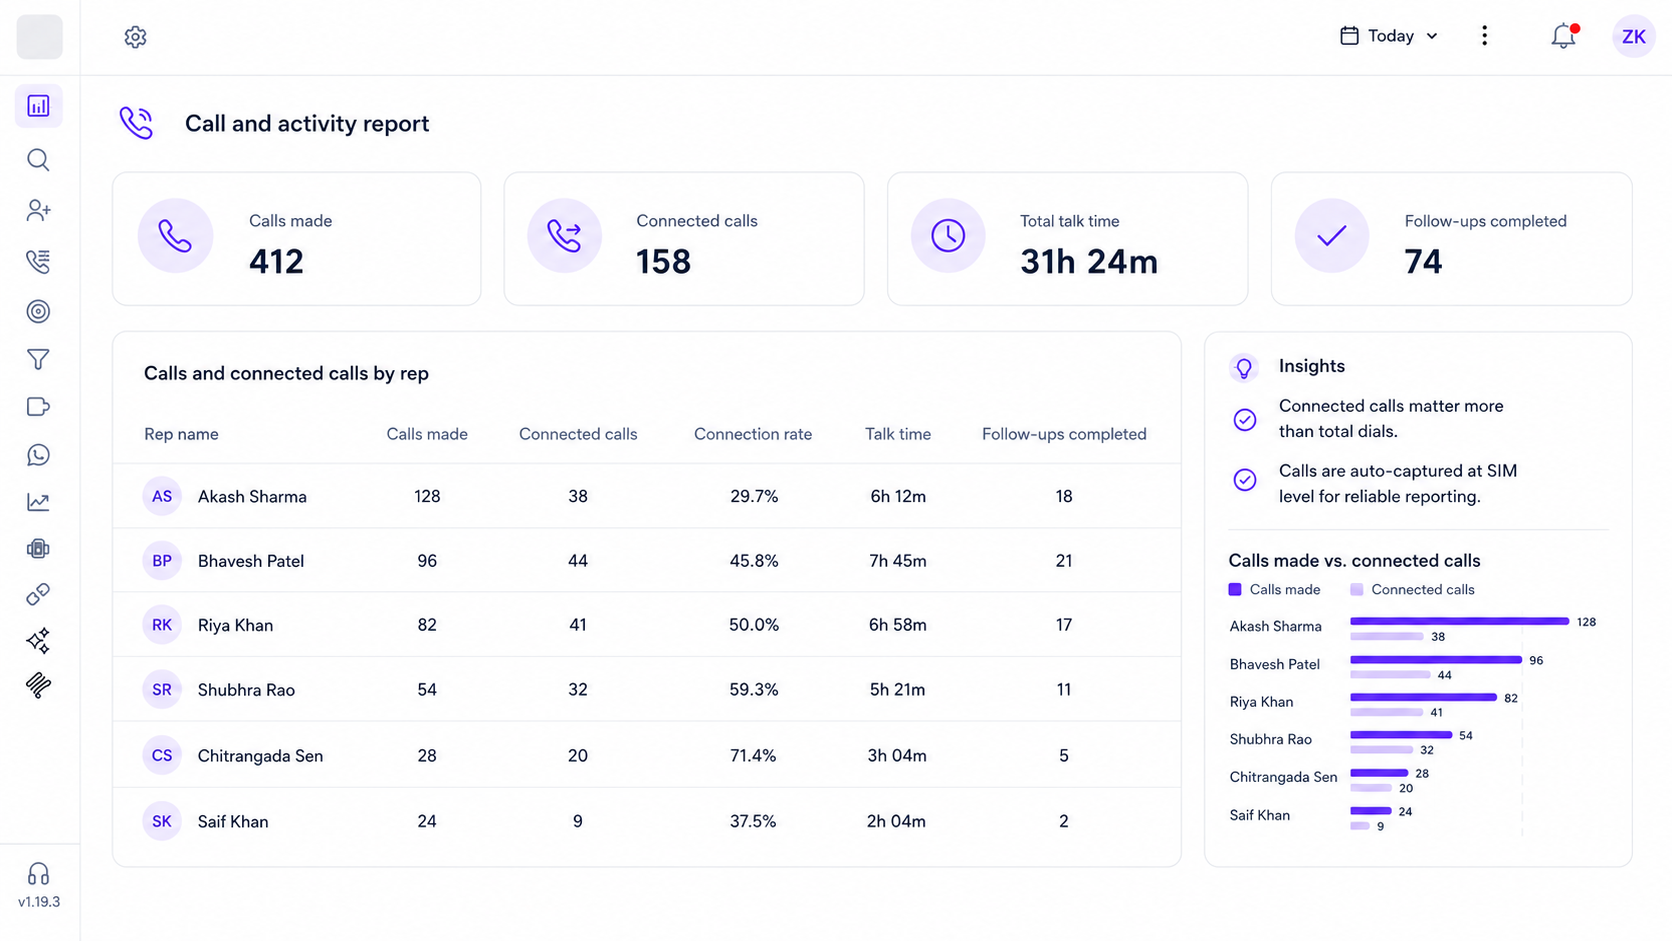
For a telecalling team, this is the report you open every morning. Look at calls made per rep, connected calls, total talk time and follow-ups completed. Connected calls matter far more than calls made. A rep who dials 90 numbers and connects on 20 does not have an effort problem; they have a data or a timing problem and shouting at them will not fix either. A rep who makes 30 calls, connects on 25 and still closes nothing has a pitch problem.
One thing to be careful about here. This report is only as honest as the call data sitting behind it. In most CRMs, the call gets recorded because the rep remembered to log it, which means your activity report is really a report on how disciplined your team is at data entry. telecrm captures calls at the SIM level, so the log happens whether the rep touches the CRM or not. That distinction decides whether this report is useful or decorative.
What it answers: Are follow-ups happening on time and how quickly are we calling new leads?
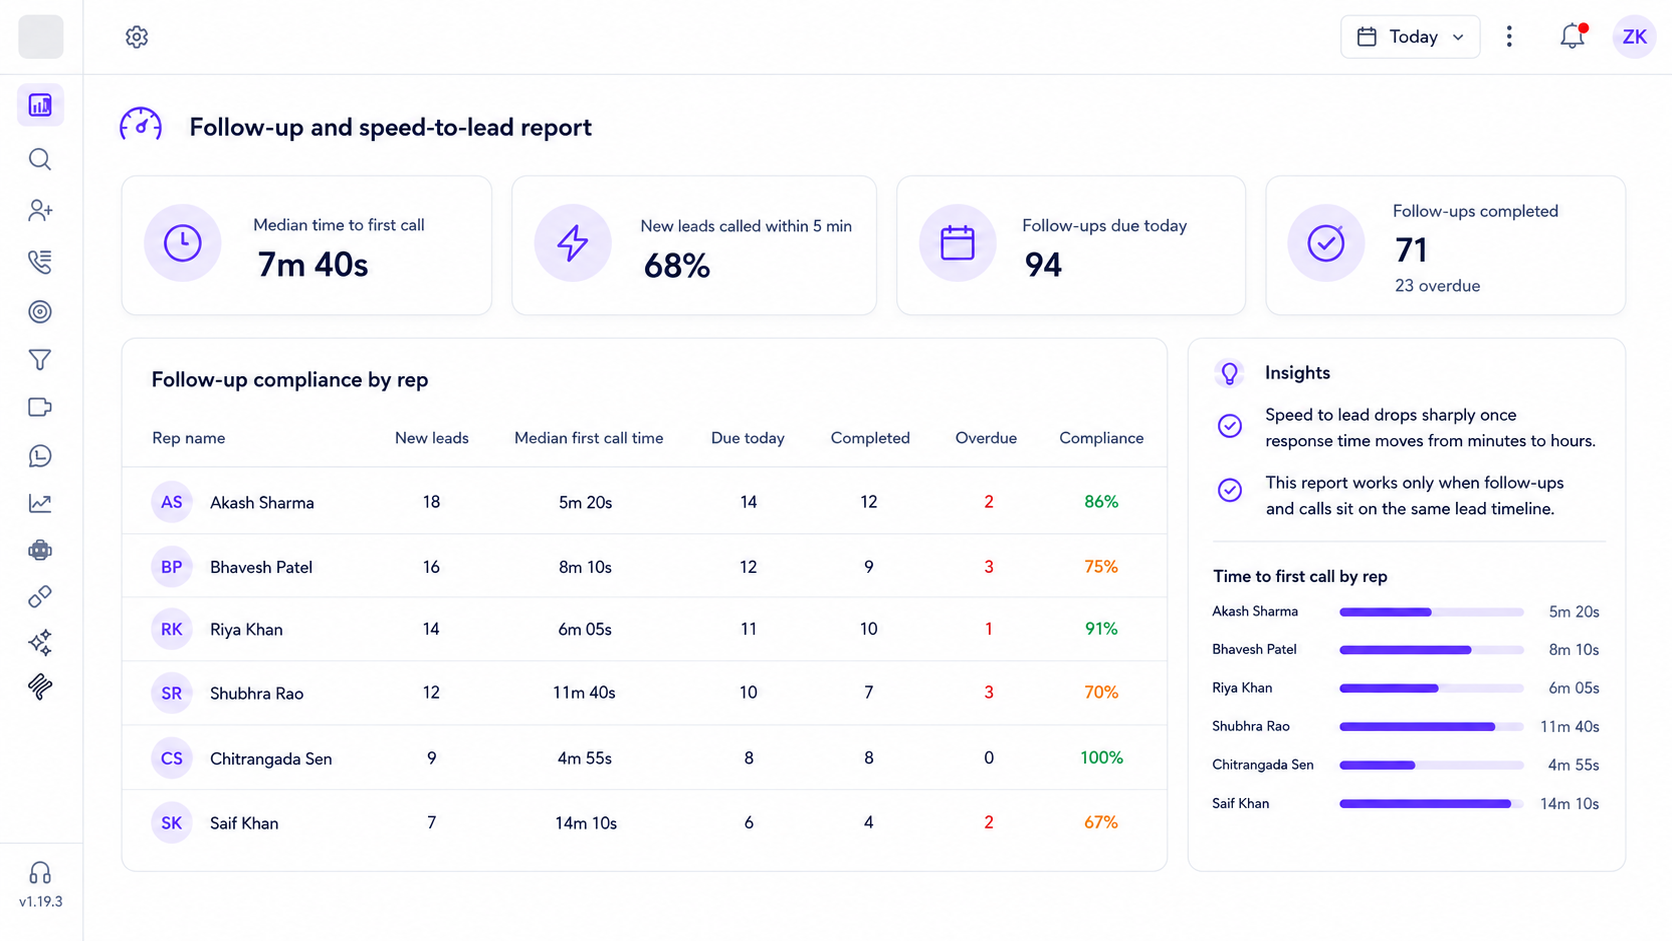
This is the report almost nobody runs and it is usually the one hiding the most revenue. Track two things. First, the median time between a lead coming in and the first call going out. Second, follow-ups due today against follow-ups actually done, split by rep.
A lead that gets called in five minutes and a lead that gets called six hours later are not the same lead any more. By the time you call, they have spoken to two of your competitors. If your median is in hours rather than minutes, fix that before you touch anything else on this list, because it is the cheapest win available to you.
The same applies to overdue follow-ups. You can only measure this if the follow-up that was scheduled and the call that actually happened sit on the same lead timeline. In telecrm they do, so the overdue list is a real list and not an estimate.
What it answers: which sources bring business, not just which sources bring leads.
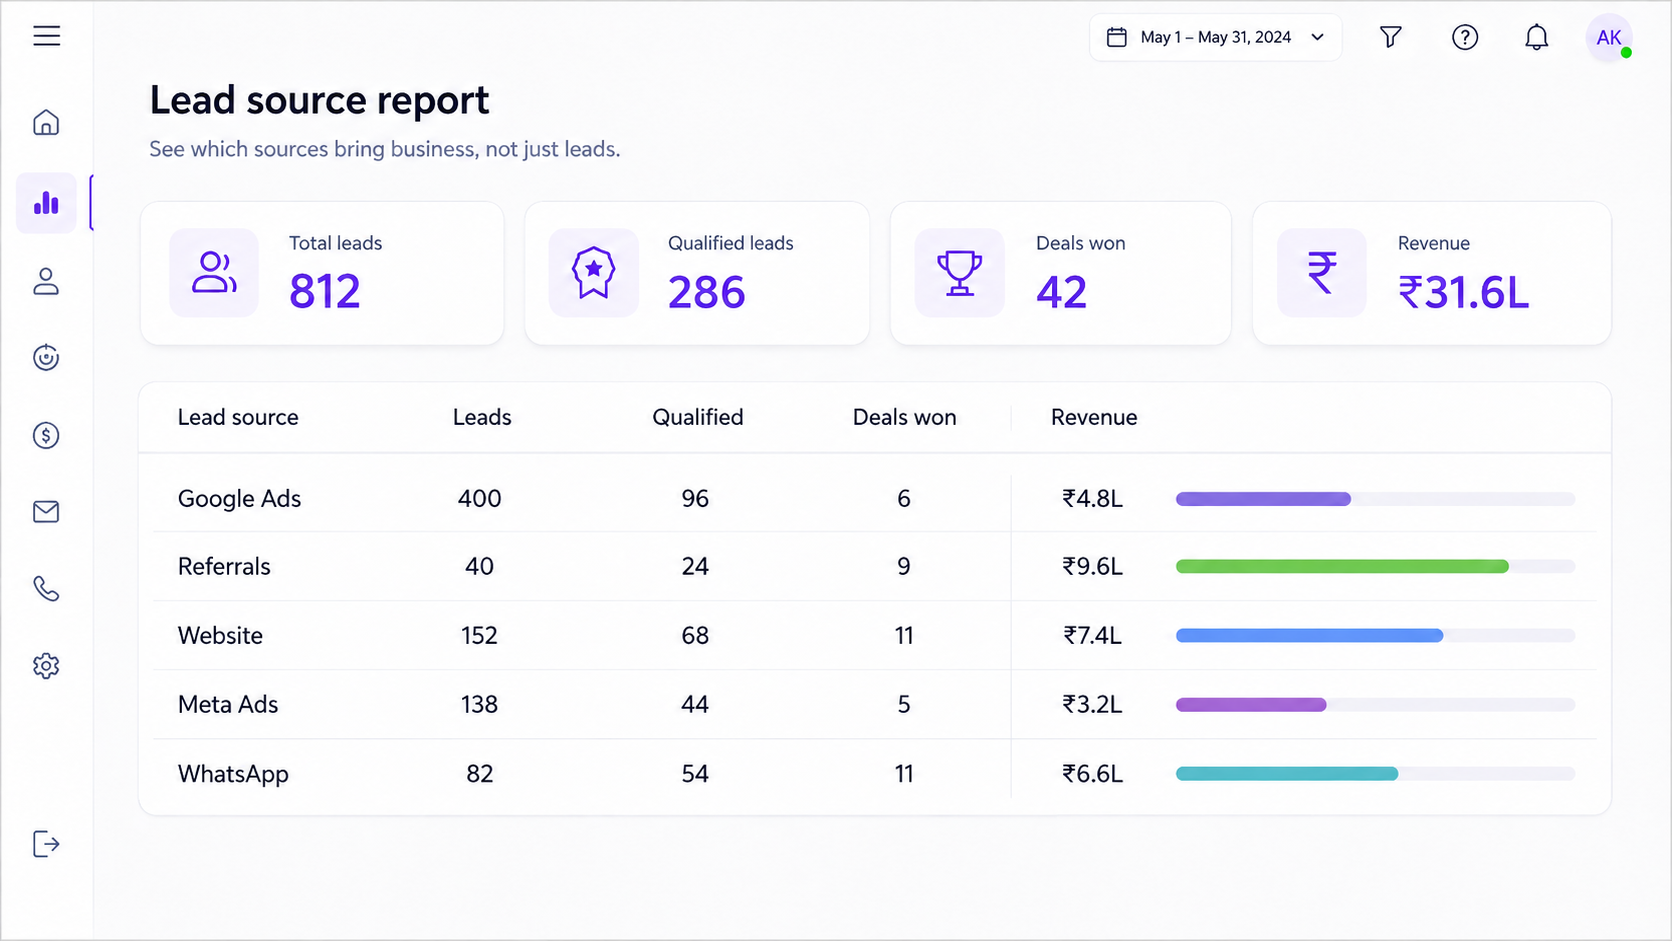
Break your leads down by source, then carry each source all the way to closure. Leads, qualified leads, deals won and revenue. If you know your spend, add cost per closure at the end.
This report almost always embarrasses somebody. Google Ads might bring 400 leads a month and close six of them. Referrals might bring 40 and close nine. The channel with the biggest number at the top is rarely the channel with the biggest number at the bottom. Once you can see that, the budget conversation stops being an argument and starts being arithmetic.
What it answers: where exactly your leads are dropping off.
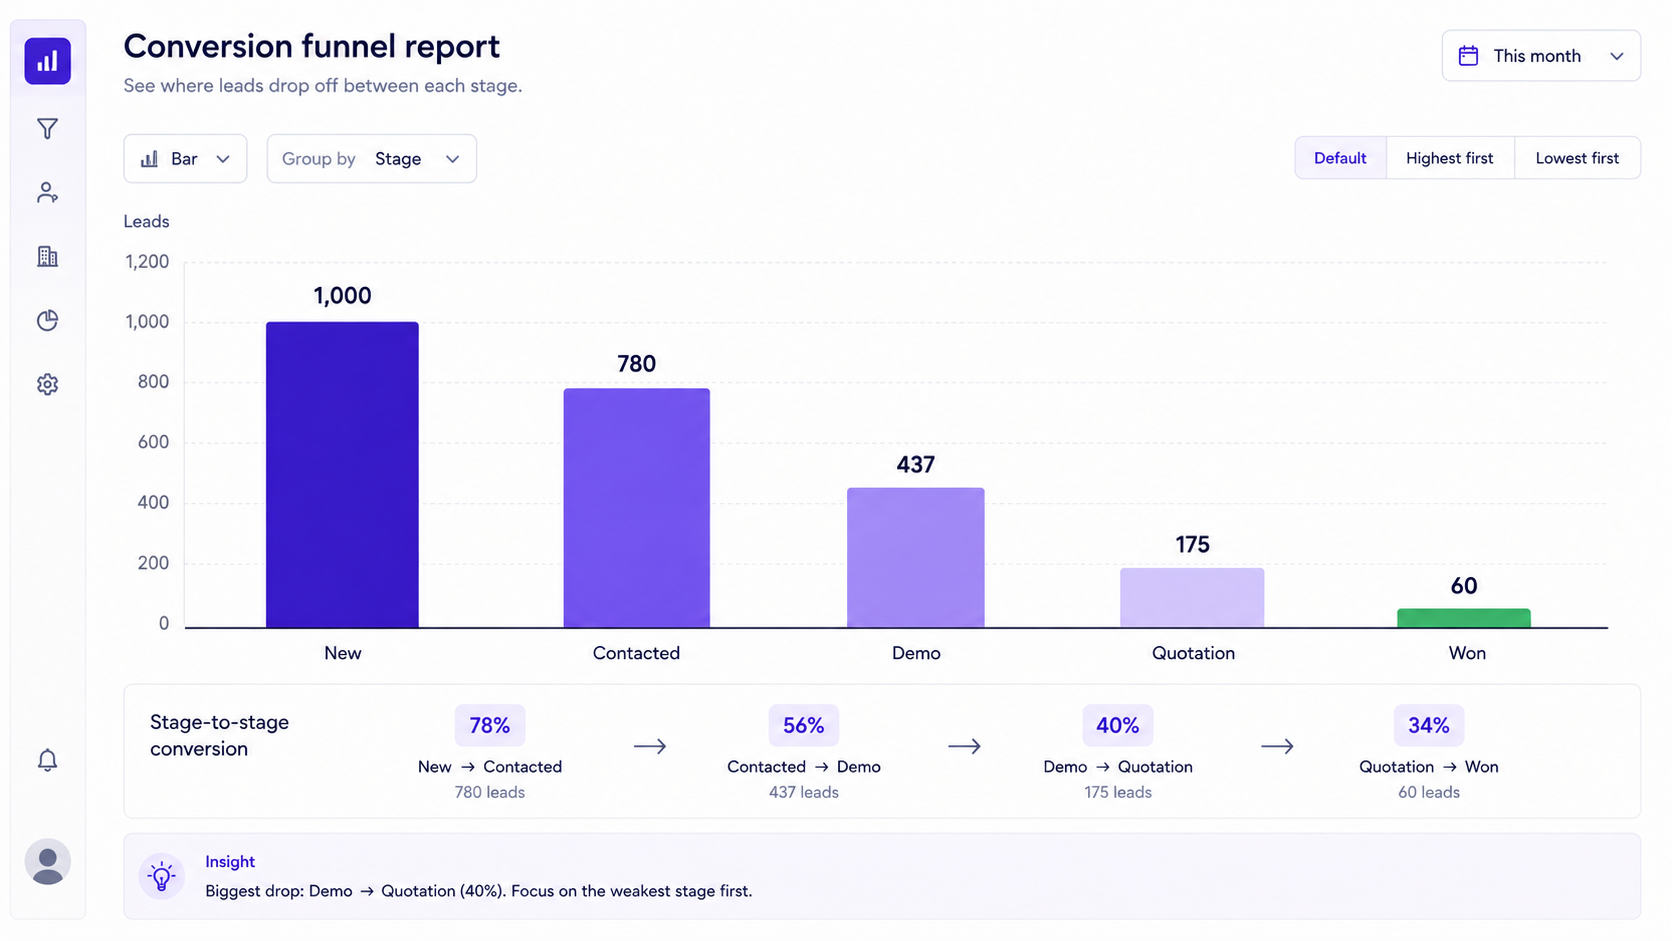
Show the percentage that moves from each stage to the next. New to contacted, contacted to demo, demo to quotation, quotation to won. You are not looking for a good overall number here, you are looking for the one stage where the percentage falls off a cliff.
If 78% of new leads get contacted but only 40% of contacted leads reach a demo, your problem is sitting in the pitch on that first call. Nothing you do at the quotation stage will fix it. Most teams try to improve the whole funnel at once and end up improving none of it. Pick the worst number, fix that stage, then run the report again in a month.
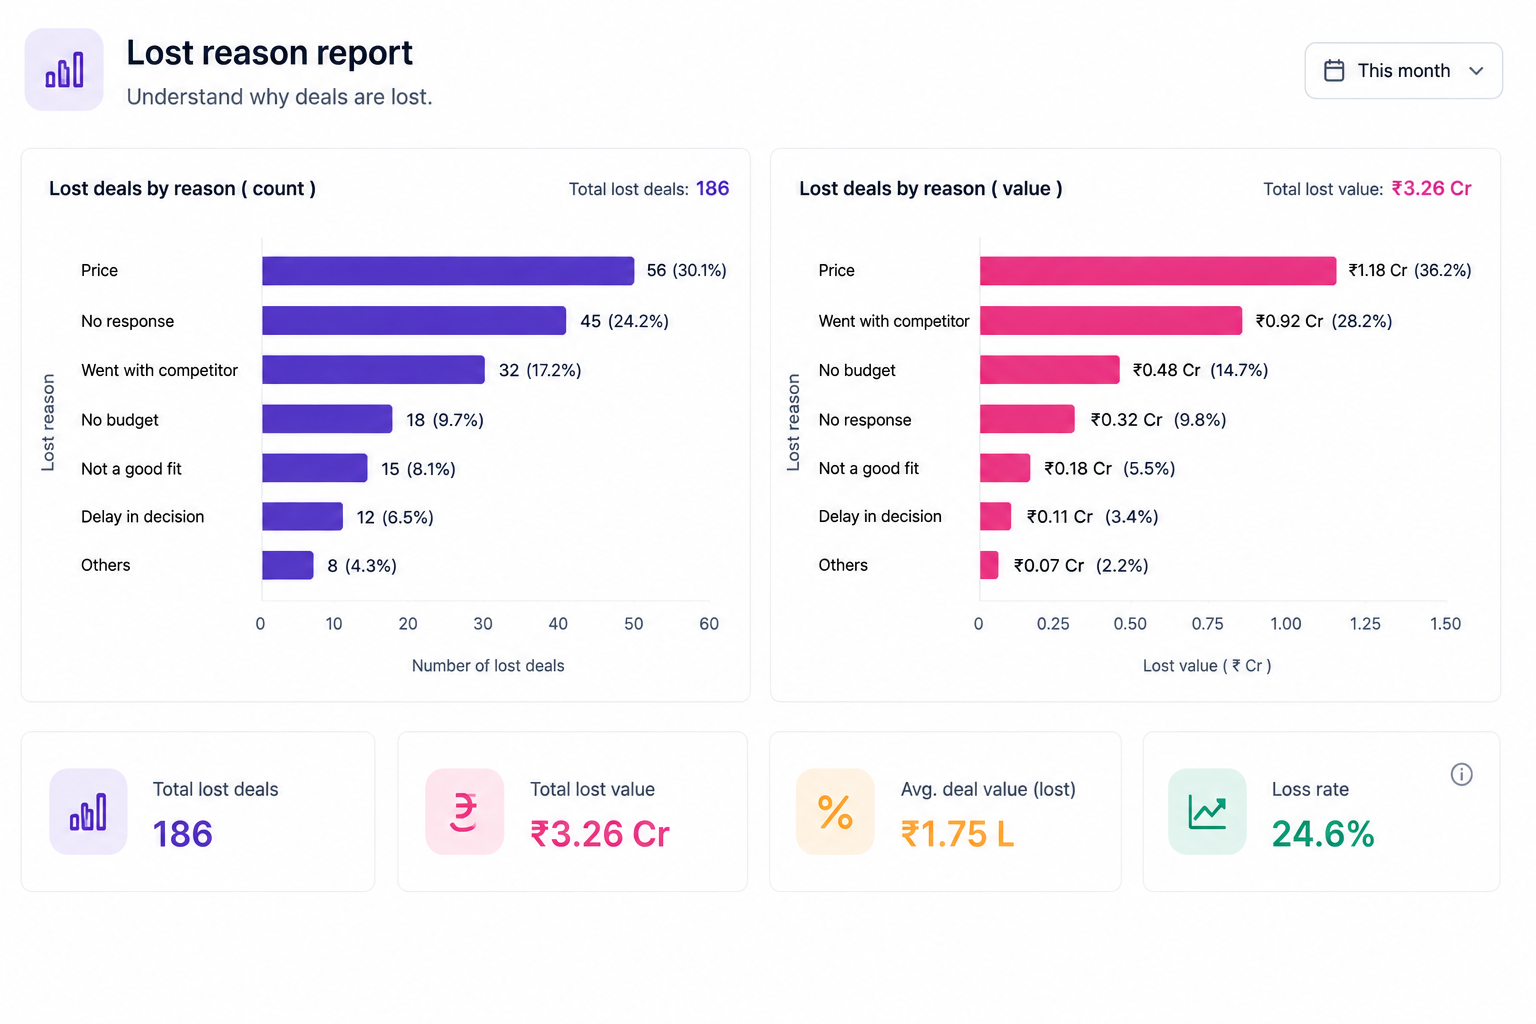
What it answers: why you are losing the deals you lose.
Count losses by reason, then do it again by value, because losing twenty small deals to price is a different problem from losing three big ones. This report only works if reps pick from a fixed list of reasons. Let them type free text and you will get forty versions of the same thing and no report worth reading.
Read the results carefully, because the obvious answer is usually wrong. If 60% of your losses say price, that is rarely a pricing problem. It is normally a qualification problem, where you are quoting to people who were never going to buy, or a value problem, where the rep never made the price feel worth it. And if a big share of losses say no response, that is not a loss at all. Those leads went cold because follow-up stopped, which sends you straight back to report three.
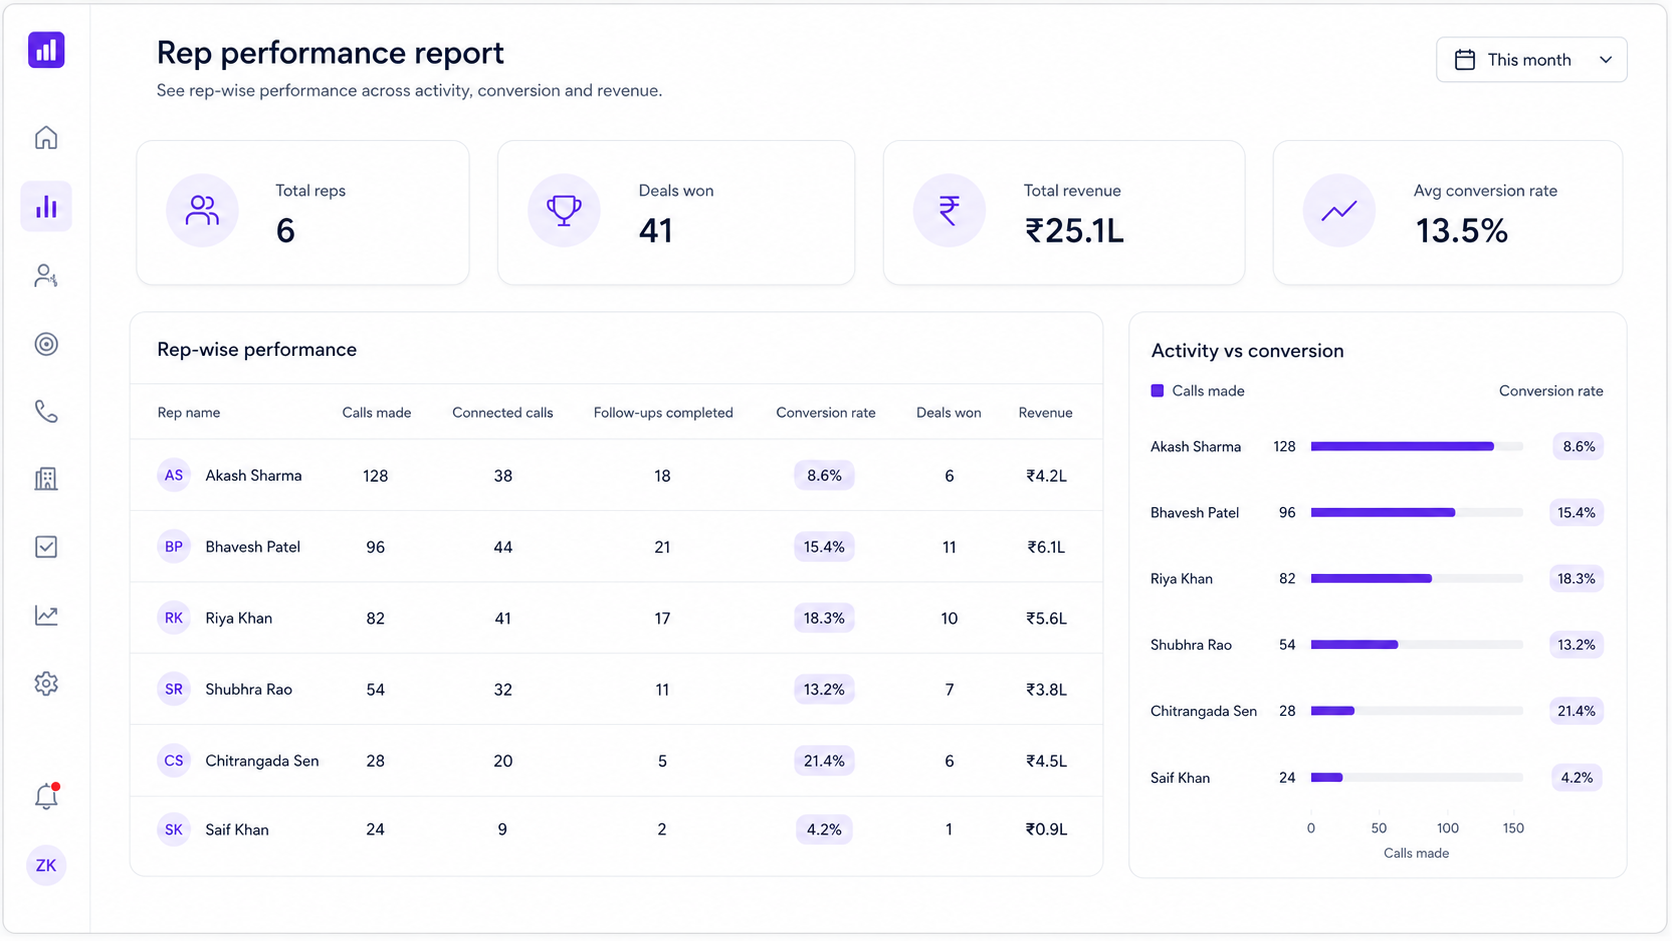
What it answers: who is performing and, more usefully, why.
Put closures and revenue next to conversion rate and activity for each rep. Revenue on its own tells you who is ahead. It does not tell you what to do about anyone.
The combinations are what you act on. High activity with low conversion means the rep is working hard and pitching badly, so they need coaching. Low activity with high conversion means your best closer is starved of leads, so give them more. Low on both is a straightforward performance conversation. High on both means you should be sitting with them for a day and writing down what they do differently, because that is your playbook.
For most SMBs, the CRM is the only reliable place to see end-to-end campaign performance – from the moment a lead enters to the moment revenue is booked.
Campaign performance reports help refine marketing strategies effectively and real-time data from CRM reports enhances marketing decision-making. For marketing teams, this section of CRM reporting is where marketing effectiveness becomes measurable – not just a feeling.
In call-driven businesses, tracking individual and team performance is as critical as tracking revenue. You need to see who is dialling, who is connecting and who is converting.
Automated reporting saves time and reduces human error and automating report distribution ensures timely insights for decision-makers – say, an automatic “Yesterday’s Call Summary” landing in the team leader’s inbox at 9 AM.
telecrm ties call recordings directly to lead outcomes, so managers can audit top performers’ calls and use those insights to coach others. This is where sales performance management becomes practical, not theoretical.
Even sales-focused CRM systems often touch support and retention by tracking post-sale interactions. Ignoring these reports means missing the signals that predict churn.
These reports help identify systemic issues. For example, long resolution times in Q1 2026 might directly explain higher churn in Q2 – a connection you will never spot without structured reporting.
When evaluating CRM solutions specifically for reporting capabilities, here is what separates the best CRM reporting tools from the rest.
AI capabilities in CRM reporting can predict trends and provide actionable insights. With 66% of organisations using AI in reporting seeing revenue increases, this is no longer a “nice to have” – it is a competitive edge.
telecrm is a sales-focused telecalling CRM built for Indian SMBs in sectors like real estate, education, finance, insurance and coaching. Over 5,000 Indian businesses use it to manage leads, calls and WhatsApp conversations from a single platform.
telecrm captures raw data from calls, WhatsApp conversations, SMS and emails, then aggregates it into sales performance and activity reports – no manual compilation needed.
A typical telecrm CRM dashboard includes tiles for “Calls Made Today,” “Connected Calls,” “Follow-ups Pending,” “Deals Won This Month,” and “Pipeline Value in Next 30 Days.” Managers see live performance of every rep; agents see their own targets and progress.
Built-in team performance tracking includes real-time monitoring of each caller’s activity, call recordings linked to leads, leaderboards for friendly competition and hour-by-hour reports showing which time slots yield the best connection rates.
telecrm’s reporting tools make it easy for non-technical founders and sales managers to build data-driven habits without lengthy onboarding or complex BI setups. Its AI Reports via MCP feature even lets users ask questions in plain English – like “how many leads didn’t get a first call within 30 minutes this week?” – and get answers instantly.
You do not need a data team to get started. Here is a simple, practical flow any SMB can follow.
1. Define objectives: Decide what questions to answer first. Examples: “Are we hitting targets?” “Which lead source gives the best conversion?” “Who needs coaching?” Answer the questions before touching any filters.
2. Choose key metrics: Map each objective to 3–5 key metrics. If your question is “Are we hitting targets?”, your metrics might be win rate, average deal size and total revenue. If your question is “Who needs coaching?”, track calls per rep, connection rate and individual conversion rate.
3. Clean and standardise data: Ensure consistent lead sources, mandatory fields, no duplicate contacts and properly updated stages. This is where data analytics becomes possible – messy data produces misleading reports.
4. Build and test reports. Start with 4–5 essential CRM reports: pipeline, forecast, campaign performance, activity and win–loss. Review them weekly. Refine columns and filters as you learn what matters.
5. Automate and share: Schedule regular sending of key reports to founders, sales heads and team leaders. Pin the most important ones to CRM dashboards so they are visible every day. Monitor progress by comparing week-over-week and month-over-month trends.
Most SMBs struggle not because they lack data, but because they cannot turn it into decisions. Here are the most common blockers.
Effective CRM reporting is not a one-time setup. It is a rhythm that gets embedded into daily, weekly and monthly routines.
Document “default report sets” for each role – founder, sales manager, marketing lead, team leader – to standardise how the business reads data. When everyone looks at the same numbers, alignment follows naturally.
CRM reporting is not a luxury for data analysts at large enterprises. It is the foundation for any sales team – even a three-person operation – that wants to identify patterns, catch problems early and grow predictably. The tools exist. The data exists. The only question is whether you will use them.
If your team works on calls and WhatsApp, reporting shouldn’t be another thing to figure out. telecrm gives you the insights you need from day one — book a demo and see how it works.
CRM reports are structured, filterable views built inside the CRM system, often with visual charts and saved configurations that update automatically as new data flows in. A raw Excel export is an unstructured data dump – a snapshot frozen in time. Saved CRM reports refresh with every new call, deal, or stage change. telecrm users can export raw data when needed, but most rely on in-app reports and CRM dashboards for day-to-day decisions because they are always current and far easier to interpret.
If data entry is consistent from day one, most SMBs can generate meaningful weekly and monthly reports within the first 2–4 weeks. Historical insight depth grows over time. By 3–6 months, sales trends, seasonality patterns and marketing effectiveness become clear. telecrm’s prebuilt reports and templates help teams start seeing value within days rather than months, because the most important CRM reports are already configured.
Start with core sales data: leads, contacts, deals, stages and activities (calls, WhatsApp, meetings). This gives you pipeline health, activity tracking and basic business health visibility immediately. The next layer is integrating lead sources from ad platforms and website forms so that campaign performance and ROI can be tracked inside the CRM. Delay complex accounting integrations until the team is comfortable using basic CRM dashboards and reports – trying to do everything at once is a common reason CRM users abandon the system.
Start with a small, fixed set of key reports and lock them as “default views” for at least one quarter. Resist the urge to add new reports every week. Review and prune metrics each quarter: remove those that do not influence decisions and merge overlapping reports. telecrm is designed for lean reporting – it focuses on essential sales and telecalling metrics instead of overwhelming users with hundreds of report types. The best CRM reporting tools are the ones your team actually opens every day.
Yes. Even a three-person team benefits from basic reports like daily activity, lead source performance and simple sales performance tracking. Without reports, you are splitting ad spend blindly. The goal is not fancy data analytics – it is avoiding guesswork and wasted budget. Business success at any scale depends on knowing what is working and what is not.



© Copyright 2026 telecrm.in (Flamon Cloudtech Pvt Ltd) - All Rights Reserved • Privacy Policy • T&C



© Copyright 2025 telecrm.in - All Rights Reserved • Privacy Policy • T&C